Summary
-
I ran the same RSI(2) mean-reversion strategy on Bitcoin, S&P 500, Nasdaq, EUR/USD, gold, and crude oil — up to 33 years of data, judged by the same pre-registered gates.
-
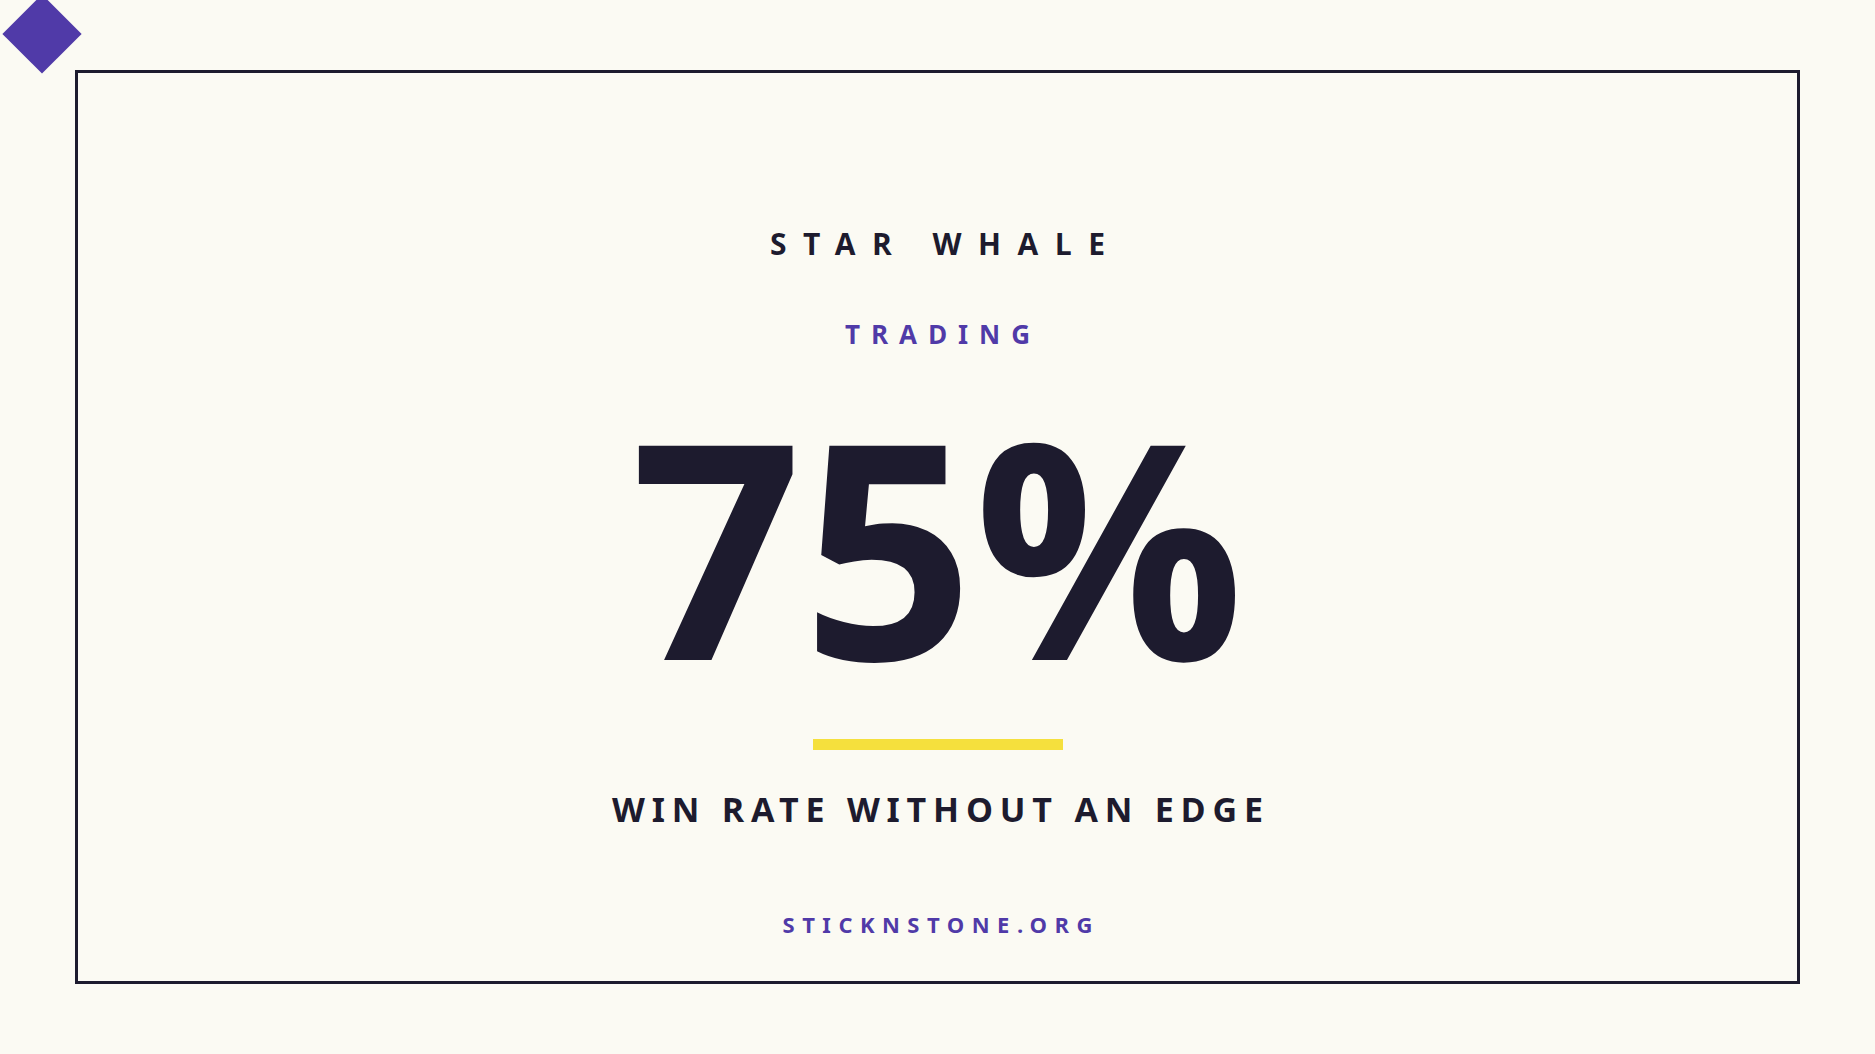
The results split. In stock indices: a 75% win rate with a 0.3% probability of being luck. In forex and oil: a coin flip. An edge has a habitat. Yet even the indices missed the final bar by a hair.
-
Timeframes split too. Hourly bars lost money; daily bars were optimal. The shorter the bar, the more fees eat the edge.
-
Even the best candidate, the S&P 500, missed one gate by a hair. Instead of bending the bar, I handed the final verdict to live forward testing.
No Reason to Stay in Crypto
Backtesting is a simulation on historical data, so it needs no brokerage account. I widened the test universe from crypto to stock indices, forex, and commodities. Adding a data source is all it takes, and a wider universe makes the test stricter, not looser.
Checking whether the same strategy works across assets is a standard robustness check in academic papers. An edge that only exists on one asset is more likely to be luck.
The strategy under test is RSI(2) mean reversion: above the 200-day moving average, buy when the 2-day RSI drops below 5 (extreme oversold), sell when it rebounds above 65. A classic published by Larry Connors in 2008.
The Result: An Edge Has a Habitat
Judged by identical gates, only the two stock indices produced strong signals. The S&P 500: 126 trades over 33 years, a 75.4% win rate, Profit Factor 2.45. EUR/USD and crude oil came in below Profit Factor 1. Like the same seed thriving or dying depending on the soil. And yet even the strongest index did not get a final pass — the reason comes below.
| Asset | Trades | Win rate | PF | Probability of luck | Verdict |
|---|---|---|---|---|---|
| S&P 500 (33y) | 126 | 75.4% | 2.45 | 0.3% | FAIL (by a hair) |
| Nasdaq 100 (27y) | 107 | 70.1% | 2.14 | 0.6% | FAIL |
| Bitcoin (8y) | 28 | 75.0% | 2.24 | 4.5% | Insufficient (sample) |
| Gold (26y) | 84 | 65.5% | 1.45 | 14% | Insufficient |
| EUR/USD (23y) | 61 | 59.0% | 0.71 | 81% | Insufficient |
| WTI crude (26y) | 67 | 61.2% | 0.82 | 73% | Insufficient |
The “probability of luck” comes from bootstrapping: re-drawing the return history in blocks thousands of times and counting how often this level of performance shows up by chance.
EUR/USD is the interesting one. The win rate is 59% — above half — yet the account shrinks because the payoff ratio is poor. Exhibit A for why win rate alone deceives.
Timeframes: Shorter Bars, More Fees, Dead Edge
I ran the same strategy on 1-hour, 4-hour, daily, and weekly bars. The result was monotonic. Hourly lost money, 4-hour broke even, daily was optimal. More frequent trading stacks up fees, and the signal itself weakens in short-bar noise. Fees were fixed at 0.1% per side across all experiments — a conservative (unfavorable) assumption for stocks.
| Setup | Trades | Win rate | Profit Factor |
|---|---|---|---|
| Bitcoin 1-hour | 266 | 54.5% | 0.55 (loss) |
| Bitcoin 4-hour | 74 | 62.2% | 1.04 (break-even) |
| Bitcoin daily | 28 | 75.0% | 2.24 |
| S&P 500 daily | 126 | 75.4% | 2.45 |
| S&P 500 weekly | 20 | 85.0% | 7.51 (small sample) |
Weekly looks the most glamorous at an 85% win rate — but that is 20 trades in 33 years. A sample that supports no statistical claim, so the verdict machine stamped it “insufficient,” not “pass.”
Missing by a Hair — How Not to Bend the Bar
Even the best candidate, the S&P 500, ultimately failed. Walk-forward validation: 9 of 13 periods positive — the bar is 70%, the result 69.2%. One period short. Lowering the bar to 69% would mean a pass. I did not.
The moment you adjust the bar after seeing the result, the bar is corrupted forever. The next strategy, and the one after, will each get its own “it was so close, just a little.”
There is a cleaner path. Opposite backtesting (testing the past) sits forward testing — wiring the strategy to live data and recording only simulated fills. Quant funds call this incubation, and they allocate no capital before it passes.
A forward test is now running on a server, checking signals every morning. The pass criteria were frozen in advance: 90+ days, 15+ simulated trades, and live win rate and payoff within the backtest’s expected range. Instead of squeezing the past harder, let the future do the grading.
Takeaways
-
An edge picks its asset. The same strategy was 0.3% likely to be luck on the S&P 500 and 81% on EUR/USD.
-
Shorter bars mean more trades and more fees; the same edge dies. This strategy’s frontier was the daily bar.
-
The most dangerous moment is a near miss. Rather than bend the bar, hand the verdict to a forward test.
Live trades so far: still zero. Not a single line of order-placing code.
Previous post: I Verified Bitcoin’s “This Chart Looks Just Like 2020” Claim With Code
References
Primary sources behind the claims in this post.
Leave a Reply